Financial data · Institutional quality

Financial data of institutional quality at an accessible price.

For online brokers and investment platforms

We are Robexia. Over 25 years structuring market data — fundamental, technical, news and liquidity and market risks — for banks, brokers and investment platforms. Coverage of the leading companies across Europe, North America and Asia-Pacific, ready to integrate via API or by file.

Our AI approach

Built on decades of quantitative R&D and expertise, not on hype.

Financial district
Global coverage

Europe · North America · Asia-Pacific. Institutional-quality data, without the cost of the major providers.

30,000+
Instruments covered
25 yrs
Market data experience
5
Data families

Solutions

Everything your platform needs for your customers.

Fundamental, technical, news, funds and ETFs, and liquidity data — structured and ready to integrate.

Data · Fundamental
Financial statements and a calculator on a desk

Fundamental Analysis

Revenue, EBIT, EBITDA, net income, P/E, dividend history and many more financial metrics from the leading companies in Europe, North America and Asia-Pacific. Structured data, ready to analyse.

Metrics Assets, liabilities and earnings
Coverage Europe · N. America · Asia-Pacific
Data · Technical
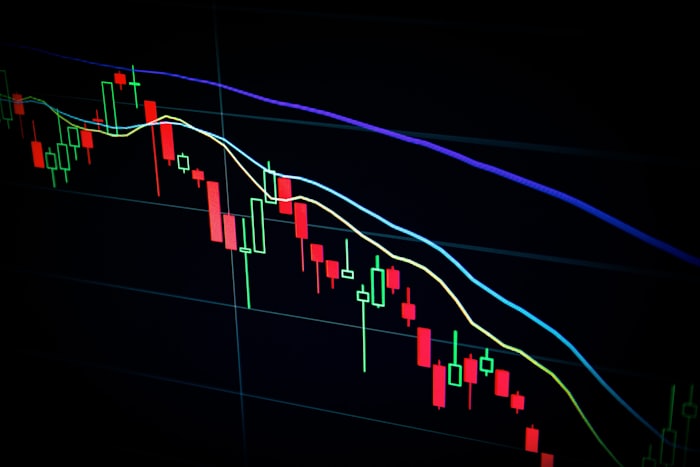
Candlestick chart with moving averages

Technical Analysis

Over 30 technical indicators, automatic trend calculation and a summary of the technical situation with key levels: supports, resistances and other relevant values.

Indicators 30+ indicators, automatic trend, supports and resistances
Coverage Europe · America · Asia-Pacific
Data · News
Stack of financial newspapers

News Radar

What is on each company’s radar right now: topics scored 0 to 10, each with a brief summary, and the same topic compared across companies.

Scores Each topic scored 0 to 10
Summary A brief summary per company
Data · Funds and ETFsNew
Fund performance chart on paper with pens

Fund and ETF Data

NAV, AUM, static data, KIDs and regulatory files (EMT, EPT, EET), received directly from asset managers and delivered unchanged to banks, brokers and financial media.

Data Daily NAV and AUM · static data · documents
Source Directly from the asset manager
Data · ETF
Laptop showing a data dashboard

ETF Screener

Find any exchange-traded fund by asset class, currency and features, and compare results side by side. Five views per fund: overview, portfolio, dividends, risk and technical analysis.

Search Ticker, name, issuer, index, ISIN or CUSIP
Views Overview · portfolio · dividends · risk · technical
Data · Macro
Office towers in a financial district

Macroeconomic Calendar

The deepest and most global market calendar: every release read straight from the national statistical agency that publishes it, with the figure exactly as it came out.

Coverage 101 countries · 1,165 indicators
Depth Every revision, as published
Risk · Regulation
Person withdrawing cash at an ATM

Liquidity Risk

Per-instrument liquidity feed and stress testing (LST) for fund managers, aligned with ESMA 2020 guidelines and CNMV supervision.

Stress test Per-instrument liquidity LST
Framework ESMA 2020 · CNMV
Open DEMO
Tool
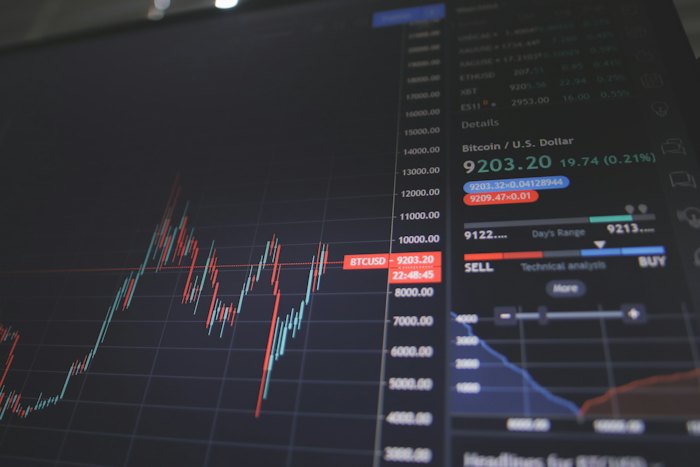
Price chart on a trading screen

Chart Tool

Professional charting platform designed by analysts. Includes market indicators with backtesting, chart pattern scanners for candlestick and Heikin Ashi, and full drawing tools: Fibonacci, Ichimoku, lines and channels. Every analysis is saved in the user's browser.

Platform 30+ indicators and metrics
For Traders and investors
Global coverage
image/svg+xmlincludes kosovo

Financial district
Robexia01 / 14
Company presentation · 2026
Financial data of institutional quality at an accessible price.
robexia.com

Company presentation · 14 slides

Robexia company presentation

Who we are, our data and products, and how to integrate them.

Who we serve

Built for institutions and integrators.

From banks to fintech startups — we adapt to any integration model.

Banks

Financial data for investment platforms.

Platforms & integrators

Data ready to integrate and redistribute.

Fintech & brokers

Reliable market data via API or file.

Presentations

For fund and ETF managers.

Two separate presentations: who we are as a fund and ETF data vendor, and the terms on which we receive and publish your data.

Market prices on a trading screen
Robexia01 / 10
For asset managers
Your funds, accurately displayed to banks, brokers and media.
robexia.com

Presentation · 10 slides

Robexia for asset managers

How we distribute your fund and ETF data to banks, brokers and media, and what we need from you.

Office towers seen from street level
Robexia01 / 5
For fund and ETF managers
Data Provider Guidelines
robexia.com

Guidelines · 5 slides

Data Provider Guidelines

How we receive your data and documents, how we handle them, and the rights you keep over them.

Data · Fundamental

Fundamental Analysis

Audited, normalised fundamentals for 12,000 listed companies: read from the primary source, delivered daily.

Companies12,000
Company-years55,000+
Full cycleDaily
01 · Source

Filings & reports

  • Regulatory XBRL: SEC, ESEF, FCA, EDINET
  • Annual-report PDFs where no XBRL exists
  • No resold vendor data
02 · Extraction

The data

  • Income statement, balance sheet, cash flow
  • Adjusted EBIT & EBITDA, P/E, P/BV, ROE, dividends
03 · Traceability

Traceability

  • Every figure knows where it comes from: filing, annual report or correction
  • And why: every change logged with its reason
  • Corrections audited and reversible, never edited by hand without a trail
  • Checked daily against an independent benchmark
04 · Client files

Delivery

  • Daily CSV files in the client’s own schema
  • ISIN + MIC identifiers, SFTP
  • Europe · North America · Asia-Pacific · LatAm

From filing to client file: every number explained.

Data · Technical

Technical Analysis

Over 30 technical indicators, automatic trend calculation and a summary of the technical situation with key levels: supports, resistances and other relevant values.

Rating, trends and levels. Technical rating, situation, trends by horizon, and price chart with supports and resistances.
Technical rating, trends and price chart with supports and resistances
Reading and indicators. Written chart reading, key levels and 30+ indicators with signal, interpretation and alerts.
Chart reading, support and resistance table and indicators

Technical analysis of a sample ETF (QQQI) at etfs.robexia.com

Data · News

News Radar

What is on each company’s radar right now: topics scored 0 to 10, each with a brief summary, and the same topic compared across companies.

EARNINGS 10
News summary · NVIDIA

The news on NVIDIA this week centres on its upcoming quarterly results, with attention on data-centre revenue and guidance. A leadership change at the top adds questions about succession and strategy, while demand for AI accelerators stays in the background.

On the radar now

NVIDIA NVDA · XNAS

Upcoming earnings release

10 / 10

Quarterly results are next on the calendar. Attention centres on data-centre revenue and guidance for the coming quarters.

CEO resignation

7 / 10

A leadership change is in the news. The open questions are succession and whether the strategy stays the same.

AI chip demand

3 / 10

Demand for AI accelerators stays in the background, with no new data moving the story this week.

Topic across companies

Upcoming earnings release

CompanyEarnings
Alphabet GOOGL
9
Microsoft MSFT
8
Apple AAPL
7
Amazon AMZN
5
Meta META
3

Illustrative example: topics, scores and summaries are not real news.

Data · Funds and ETFs New

Fund data, straight from the asset manager.

We have recently launched a new line of business as a data vendor for funds and ETFs: the same role as the large vendors, on a much smaller scale. Asset managers send us their data directly, and we deliver it to our clients.

What we receiveDetail
PricesDaily NAV and AUM
Static dataISIN, share class, currency, domicile, distribution, ongoing charges, benchmark
DocumentsKID, factsheet and EMT / EPT / EET
RegistrationCountry registration status per share class
Source

Asset managers

Official data and documents, by email or file, to [email protected]

Robexia

Validation and loading

Official data, loaded exactly as supplied. We work under our banking clients’ regulatory requirements, including DORA for ICT third-party providers.

Clients

Banks · Brokers · Media

Screeners, fund pages and comparison tools for their customers and readers

From the asset manager to the screens of banks, brokers and financial media.

Data · ETF

ETF Screener

Find any exchange-traded fund by asset class, currency and features, and compare the results side by side.

Universe

ETFs across currencies and exchanges

Search

Ticker, name, issuer, index, ISIN or CUSIP

Filters

Asset class, features, dividends, currency and exchange

Compare

Tracked index, expenses, assets, 1-year return, dividends

Robexia ETF Screener
ETF Screener at etfs.robexia.com

Each fund, five tabs of data

Overview. Net assets, expenses, performance, price, risk at a glance, key identifiers and official documents.
ETF overview tab
Portfolio. Holdings and concentration, with breakdowns by asset type, country and sector.
ETF portfolio tab
Dividends. Distribution history and yield of each fund.
ETF dividends tab
Risk. Volatility, drawdown and risk measures of each fund.
ETF risk tab
Technical analysis. Technical rating, trends by horizon, key levels and 30+ indicators.
ETF technical analysis tab
Open ETF Screeneretfs.robexia.com

Data · Macro

Macroeconomic Calendar

The deepest and most global market calendar: every release read straight from the national statistical agency that publishes it, with the figure exactly as it came out.

  • Every revision, as published
  • Read straight from the national statistical agencies
Countries101
Indicators1,165
Robexia Economic Calendar
Economic Calendar at macro.robexia.com
Discover the calendarmacro.robexia.com

Risk · Regulation

Liquidity Risk

Risk · Regulation · Built for fund managers

Liquidity feed and stress testing

Per-instrument liquidity feed and stress testing (LST) for fund managers, aligned with ESMA 2020 guidelines and CNMV supervision.

  • Redemption coverage (RCR) in normal and stress scenarios, at 1, 2, 5 and 10 business days
  • Reverse stress testing: the redemption rate or liquidity shock that breaks minimum coverage
  • Historical scenarios: base, GFC 2008 (three phases) and COVID March 2020
Liquidity LSTESMA 2020CNMV
Sample output

Reverse stress testing

Coverage breaking point (minimum RCR 50%, 1-day horizon)

MeasureValue
Passive RST (redemption rate that breaks 50% RCR, stress) · pro-rata saleAbove 100%
Passive RST · selling the most liquid firstAbove 100%
Active RST (market-value liquidity shock that breaks 50% RCR) · pro-rata sale0.10
Stress cost: prudent – favourable1.57 bp
Normal cost: prudent – favourable0.26 bp
Passive RST: prudent / favourableAbove 100% / Above 100%
Active RST: prudent / favourable0.10 / 0.10

Reverse stress testing extract from a liquidity report

Open DEMOliquidity.robexia.com

Tool

Chart Tool

Professional charting platform designed by analysts, for traders and investors.

Indicators

40+ indicators, with the full Ichimoku

Backtesting

Indicator strategies: win rate, drawdown and performance

Scanners

Candlestick, Heikin Ashi and chart formations

Drawing tools

Fibonacci, lines, channels and levels

Robexia Chart Tool with the Ichimoku indicator
Chart Tool at charts.robexia.com
Open Chart Toolcharts.robexia.com

Our AI approach

Built on decades of quantitative R&D, not on hype.

AI & Data

Data and processes
where signal dominates

In data extraction, financial documents and validation, AI performs at its best. Agents cross-reference sources, detect anomalies and track traceability at a scale impossible for any human team. The key lies in orchestration: deterministic code where rules are clear, LLMs where context and judgment matter, human judgment where decisions are critical. Each layer has its function.

AI & Markets

Financial markets
where noise dominates

Before applying AI to any domain, the key question is the signal-to-noise ratio. In financial markets that noise is structurally high — which is why reducing it matters more than fine-tuning models. Experience here is not a complement: it is the filter that makes ML techniques useful rather than dangerous.

Where AI earns its place

Used with judgment, AI multiplies a good team: it extracts, cross-checks and validates data at a scale no human could reach, freeing experts for what truly needs judgment.

Beware the hype

In markets, noise dominates. Behind the AI hype, a model without experience as its filter produces more noise, not more signal. Data Noise reduction is essential.

About Us

Decades of expertise. Built for today.

We combine deep quantitative experience with modern technology to deliver institutional-grade data at scale.

Experience

Over 25 years building algorithms and quantitative analysis, with structured, accessible financial data for clients worldwide.

Agility & flexibility

We adapt fast to clients and integrators, with competitive pricing against the major market providers.

Technology & AI

We pair decades in financial markets with cutting-edge technology and AI.

Integration

Connect in minutes.

REST API or file delivery — your choice. JSON, XML, CSV. Complete documentation and dedicated support for integration.

REST API JSON XML CSV SFTP Webhook
// GET /v1/fundamental/{isin} { "isin": "ES0113900J37", "ticker": "SAN", "name": "Banco Santander S.A.", "revenue": 56789.4, "ebit": 12340.1, "pe_ratio": 7.82, "consensus": "BUY", "price_target": 5.40 }

Let's talk.

Chart Tool
Liquidity Risk Tool
Macroeconomic Calendar
Regulatory tracking
Fundamental Data
Technical Analysis Data
News Radar
Message sent! We'll get back to you soon.
Please write at least 10 characters.

By submitting this form you confirm you have read our Privacy Policy.